UNC NUCLEAR ASTROPHYSICS
Department of Physics & Astronomy
Laboratory for Experimental Nuclear Astrophysics
UNC NUCLEAR ASTROPHYSICS
Department of Physics & Astronomy
Laboratory for Experimental Nuclear Astrophysics

VISUALIZATIONS
1. Experimental Monte Carlo Based Reaction Rates
Our group has developed a method of estimating rigorous experimental uncertainties of thermonuclear reaction rates. Details can be found in the papers by Longland et al. (2010) or Sallaska et al. (2013). In brief, all the nuclear physics input quantities, such as resonance energies and strengths, non-resonant cross sections, partial widths, spectroscopic factors, etc., are sampled randomly according to physically motivated probability density functions. For each set of input quantity samples, the thermonuclear reaction rate is computed. The process is repeated many times in a Monte Carlo procedure and the resulting ensemble of rate samples is used to determine the rate probability density, which can be used to derive a rate uncertainty according to a desired coverage probability. This procedure has not been applied previously. It is thus important to visualize the results in order for the community to better understand how to interpret these Monte Carlo based rates.
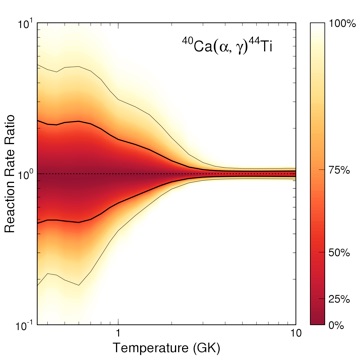
An example is shown on the right. The x-axis displays the stellar temperature in Giga-Kelvin, and the y-axis shows the thermonuclear reaction rate for the 40Ca(a,γ)44Sc reaction, normalized to the median rate, for each temperature. A statistically rigorous uncertainty must be defined by a coverage probability. The darker the color shading the larger the reaction rate per unit rate interval. For example, the area enclosed by the thick solid lines corresponds to a coverage probability of 68%, while the area enclosed by the thin solid lines corresponds to a probability of 95%. Contour plots such as the one displayed here make the important point that there is no reaction rate “upper limit” or lower limit”, as sometimes claimed in the literature. Certainly, any reported rate uncertainties should never be interpreted as sharp boundaries. Instead, the figure demonstrates that the reaction rate probability density function, at each temperature, is a continuous and smooth function. The first graph of this kind was published in Pogrebnyak, Howard, Iliadis, Longland and Mitchell, Physical Review C 88, 015808 (2013).
2. Fractional Contributions to the Total Rate of a Reaction
It is frequently of interest to identify the main contributions to the total reaction rate at a given temperature. For example, suppose you would like to design an experiment and you need to determine what exactly needs to be measured and to what precision. The Monte Carlo method can easily be adopted for this purpose. Since each nuclear physics input parameter is sampled according to a physically motivated probability density function, the Monte Carlo sampling provides a statistically rigorous coverage probability for each rate contribution.
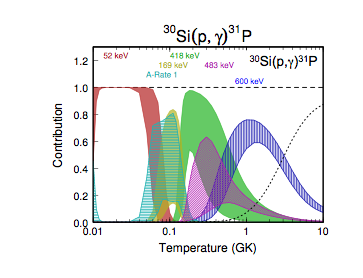
An example is shown in the figure above on the right. It displays the main fractional contributions of individual observed or unobserved resonances to the total 30Si(p,γ)31P Monte Carlo reaction rate. This reaction is of particular interest for interpreting observed silicon isotopic ratios in nova candidate presolar grains. Different colors correspond to contributions of different resonances, while the vertical width of each band signifies a coverage probability of 68%. Inspection of the figure identifies what needs to be measured in order to improve the total reaction rate estimate. For example, at typical classical nova peak temperatures near 200-300 MK, the total rate is dominated by the uncertainties in the contributions of the 418 keV and the 483 keV resonances. The former has not been directly observed yet, while the latter has been observed, albeit with a large uncertainty in the experimental resonance strength. This graph was published in Champagne, Iliadis and Longland, AIP Advances 4, 041006 (2014).